The stock market is a dynamic and ever-changing environment, with investors constantly seeking new ways to make profitable trades. One tool that investors use to analyze stock market trends and make informed decisions is stock charts. Stock charts are graphical representations of stock price movements over time, and they provide valuable insights into market trends and patterns. In this article, we will discuss some of the most commonly observed stock chart patterns and their significance.
Head and Shoulders
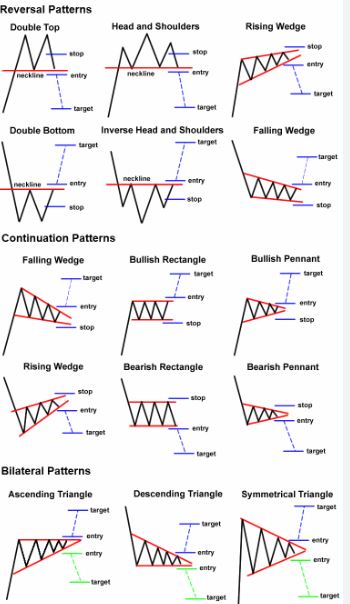
The head and shoulders pattern is a popular technical analysis chart pattern used to predict market trends. It consists of three peaks – two smaller ones on either side of a larger one in the middle. The pattern looks like a head and shoulders, hence the name. This pattern is often a signal that a bullish trend is coming to an end and a bearish trend is about to begin.
Cup and Handle
The cup and handle pattern is a bullish continuation pattern that indicates a pause in the upward trend. It consists of a cup-like shape followed by a smaller handle. The cup is formed by a rounded bottom, while the handle is a downward-sloping trend line that follows the cup. This pattern is often used by traders to identify potential buying opportunities.
Double Top and Double Bottom
The double top and double bottom patterns are reversal patterns that signal a trend reversal. The double top pattern is formed when the stock price reaches a peak twice, and then drops. The double bottom pattern is formed when the stock price hits a low twice and then rises. These patterns are often used by traders to identify when a stock price is about to change direction.
Ascending and Descending Triangles
The ascending and descending triangles are continuation patterns that signal a continuation of the current trend. The ascending triangle is formed by a horizontal resistance line and an upward sloping trend line. The descending triangle is formed by a horizontal support line and a downward sloping trend line. These patterns are often used by traders to identify potential entry and exit points.
Flags and Pennants
The flag and pennant patterns are continuation patterns that signal a continuation of the current trend. The flag pattern is formed by a rectangular shape followed by a short-term price movement that moves in the opposite direction to the original trend. The pennant pattern is formed by a symmetrical triangle shape, which is followed by a short-term price movement that moves in the opposite direction to the original trend. These patterns are often used by traders to identify potential entry and exit points.
Wedges
The wedge pattern is a reversal pattern that signals a trend reversal. It is formed by two converging trend lines that slope in the same direction. The pattern can be either bullish or bearish, depending on the direction of the trend. These patterns are often used by traders to identify potential entry and exit points.
In conclusion, stock charts are an essential tool for investors to analyze market trends and make informed trading decisions. By understanding the different types of chart patterns, investors can identify potential buying and selling opportunities, as well as determine the direction of a stock price trend. However, it is important to note that chart patterns are just one aspect of technical analysis and should be used in conjunction with other indicators to make informed decisions.